EXCEL DASHBOARD FOR URBANMART STORE
Project Overview
As a Data Analyst for UrbanMart, a mid-sized retail chain, I was tasked with transforming raw sales, product, and inventory data into actionable business insights. The project involved data cleaning, statistical analysis, financial forecasting, sales performance tracking, inventory management, dashboard development, and process automation to support data-driven decision-making.
Objectives
- Improve data quality and reliability.
- Analyze sales performance and customer purchasing patterns.
- Forecast future revenue and profitability.
- Enhance inventory management through automated alerts.
- Develop an interactive dashboard for management reporting.
- Automate recurring reporting processes.
Methodology
- Data Cleaning
- Removed invalid sales records and standardized data formats.
- Created a Total Revenue metric using quantity, unit price, and discounts.
- Improved dataset accuracy and consistency for analysis.
- Statistical Analysis
- Calculated key metrics including mean, median, mode, standard deviation, and sales correlations.
- Assessed the relationship between discounts and product demand.
- Analyzed sales distribution trends to identify peak selling periods.
- Financial Modeling
- Developed a three-month revenue forecast model.
- Projected Q4 revenue using historical growth trends.
- Estimated gross profit and evaluated best-case and worst-case business scenarios.
- Sales Tracking
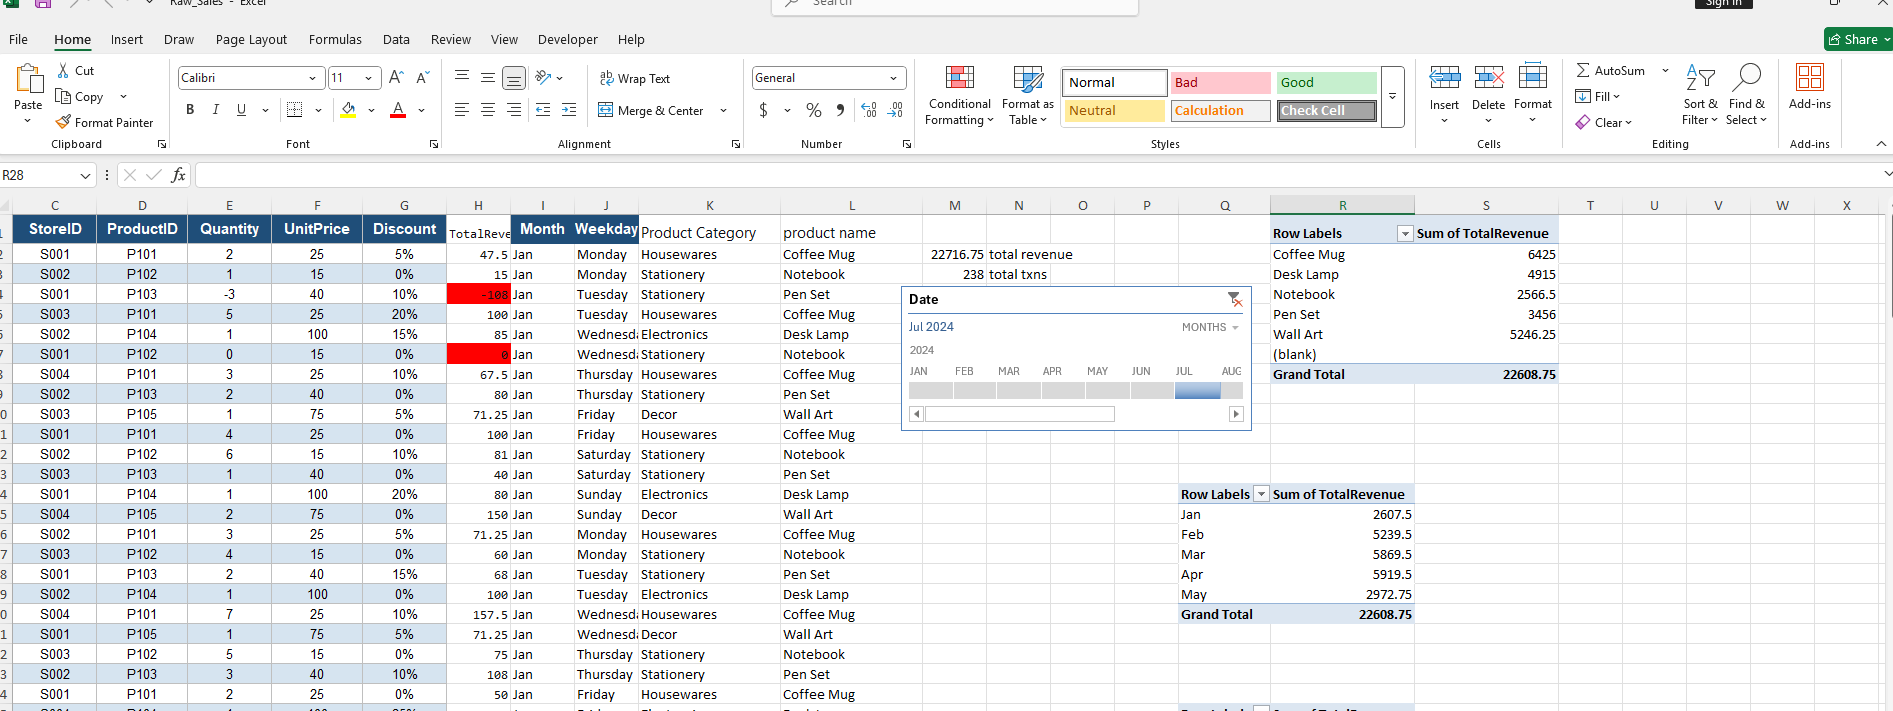
- Built PivotTables and trend analyses to monitor sales performance by category and period.
- Enabled filtering by store location to support management reporting.
- Identified seasonal sales patterns and category performance trends.
- Inventory Management
- Designed a reorder alert system using inventory thresholds.
- Automated identification of low-stock products.
- Reduced the risk of stockouts and potential revenue loss.
- Dashboard Development
- Created an interactive dashboard featuring revenue, sales trends, product performance, and store-level insights.
- Implemented slicers, charts, and key performance indicators (KPIs) for easy analysis.
- Automation
- Developed a macro to refresh reports, clear filters, and export dashboards automatically.
- Significantly reduced reporting preparation time and improved operational efficiency.
Key Insights & Business Impact
- Discounting showed a positive influence on sales volume, indicating that promotional pricing can drive customer purchases.
- Sales trend analysis revealed opportunities for targeted seasonal marketing campaigns.
- The inventory alert system improved stock management and helped prevent potential lost sales.
- Financial forecasts provided management with visibility into expected revenue growth and profitability.
- Automation streamlined reporting processes, enabling faster and more efficient decision-making.
Conclusion
This project demonstrates the application of Excel-based data analytics techniques, including data cleaning, statistical analysis, financial modeling, dashboard design, inventory management, and automation. The resulting insights and tools support informed business decisions, improved operational performance, and enhanced revenue growth for UrbanMart.
Download full project on github: https://github.com/ShamimNandawula/excel-urbanmart-project